Help
Introduction
Emerging high-throughput technologies like next-generation sequencing (NGS) have led to a dramatic increase of descriptive and functional genetic information over the past decade, revealing gene properties such as gene family, tissue distribution, gene function or pathway membership. Further processing of these properties into gene similarities beyond sequence homology enables the unbiased exploration of inter-gene relationships. Existing computational tools which apply such gene relationships are e.g. UCSC Gene Sorter [1] and EvoCor [2]. However, these tools apply each similarity independently and don't make use of multidimensional scoring.
Term-to-Gene Search
Genehopper is a new search engine with a focus on human genes which allows the exploration of gene-to-gene relationships. It can handle two different query types: the typical use case starts with a term-to-gene search (Figure 1), i.e. an optimized full-text search for an anchor-gene of interest. The web-interface can handle one or more terms including gene symbols and identifiers of Ensembl, UniProtKB, EntrezGene and RefSeq. Additionally Genehopper can find genes by publication or SNP variant identifiers, even unspecific vocabulary is handled.
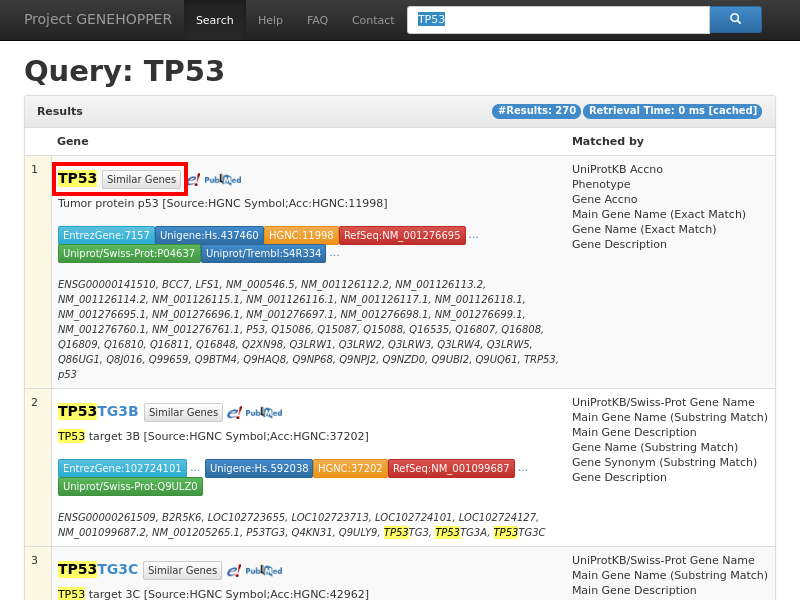 Figure 1. Result page of the term-to-gene search with the exemplary query string TP53. Each row
in the result list corresponds to a single human gene at which the top one list is supposed
to be the most relevant gene concerning the user query. A gene can be selected as anchor for the second search
type by clicking on the "Similar Genes" button in the red rectangle. More detailed information about a gene can be requested by clicking on its gene name.
Figure 1. Result page of the term-to-gene search with the exemplary query string TP53. Each row
in the result list corresponds to a single human gene at which the top one list is supposed
to be the most relevant gene concerning the user query. A gene can be selected as anchor for the second search
type by clicking on the "Similar Genes" button in the red rectangle. More detailed information about a gene can be requested by clicking on its gene name.Gene-to-Gene Search
When the anchor-gene is defined, the user can explore its neighbourhood as the weighted sum of normalized gene similarities according to Table 1.
| Similarity | Data Source | Measure | |
|---|---|---|---|
| 1. | Homology SHOM | Ensembl Compara | Sequence Identity |
| 2. | Normal Tissue Expression Profile SNEX | Human Protein Atlas | Spearman |
| 3. | Interpro Protein Domain SIPD | Swissprot | Cosine |
| 4. | Swiss-Prot Protein Feature SSPF | Swissprot | Cosine |
| 5. | Variant-related Publications SVP | Ensembl Variation | Cosine |
| 6. | GO Cellular Component SCC | Ensembl Core | Resnik-BMA |
| 7. | GO Molecular Function SMF | Ensembl Core | Resnik-BMA |
| 8. | GO Biological Process SBP | Ensembl Core | Resnik-BMA |
| 9. | HUGO Gene Symbol SHGS | HGNC | Prefix Distance |
All gene-to-gene similarities are pre-calculated to ensure fast retrieval time. Each weight can be adjusted by the users and thus allowing flexible customization of the gene search according to specific use cases. Result genes are ranked in descending order according to their overall ranking score which is given by the weighted sum of pairwise similarities between the anchor gene and all other genes (Figure 2).
All implemented similarities have a low to pairwise correlation (max r2 = 0.35) implying a low linear dependency i.e. any change in a single weight has an effect on the ranking. Thus, we treated them as separate dimensions in the search space.
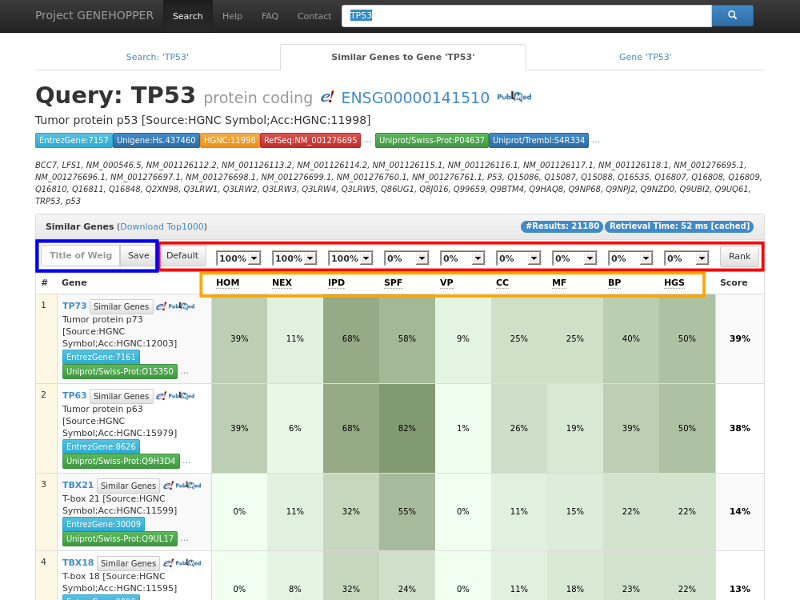 Figure 2. Result page of the gene-to-gene search with the exemplary query gene TP53. Each row in the
result panel corresponds to a gene for which nine similarity scores and a ranking score is
displayed. (Red rectangle) The ranking can be adjusted by reconfiguring the weights with the dropdown fields.
(Blue rect.) Weight profiles can be saved for later searches by providing a profile name.
(Orange rect.) Additional information about each similarity can be displayed by clicking on the similarity abbreviations.
To enable further analysis of the results, the top 1000 genes as well as their similarity values can be downloaded ("Download Top1000").
Moreover we provide raw data for each pair of anchor gene and result gene by clicking into the cell of a specific similarity value or on the overall score.
Figure 2. Result page of the gene-to-gene search with the exemplary query gene TP53. Each row in the
result panel corresponds to a gene for which nine similarity scores and a ranking score is
displayed. (Red rectangle) The ranking can be adjusted by reconfiguring the weights with the dropdown fields.
(Blue rect.) Weight profiles can be saved for later searches by providing a profile name.
(Orange rect.) Additional information about each similarity can be displayed by clicking on the similarity abbreviations.
To enable further analysis of the results, the top 1000 genes as well as their similarity values can be downloaded ("Download Top1000").
Moreover we provide raw data for each pair of anchor gene and result gene by clicking into the cell of a specific similarity value or on the overall score.
- Kent,W.J.D.et al. (2005) Exploring relationships and mining data with the UCSC Gene Sorter. Genome Res, 15(5), pp. 737-741. doi:10.1101/gr.3694705
- Dittmar,W.J. et al. (2014) EvoCor: a platform for predicting functionally related genes using phylogenetic and expression profiles. Nucleic Acids Res, 42(W1):W72-W75. doi:10.1093/nar/gku442
Introduction
Qtlizer annotates lists of common human single nuceleotide polymorphisms (SNPs) with associated changes in gene expression using the, to-date, most comprehensive database of published expression quantitative trait loci (eQTLs).
- What is Qtlizer about?
- How to use it
- eQTL datasets in Qtlizer
- A note of caution
- Implementation
- REST API & R package
- Browser compatibility
What is Qtlizer about?
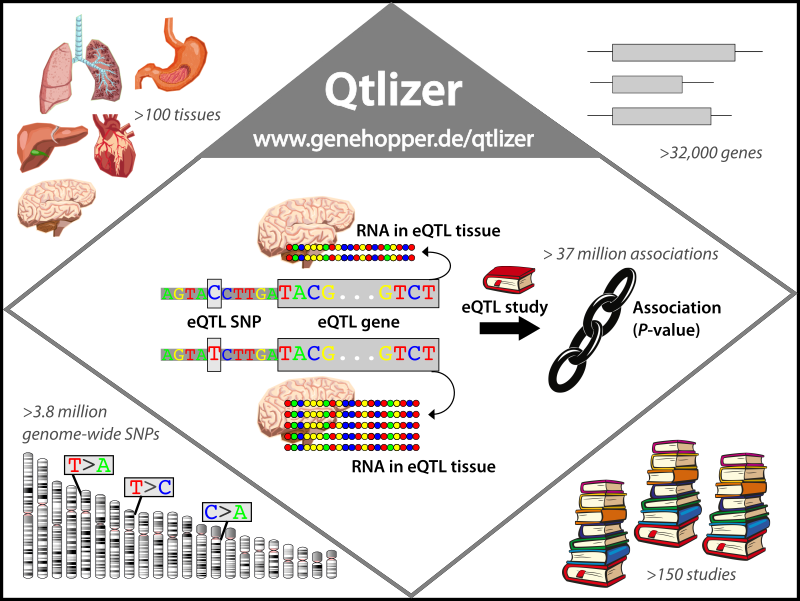 Figure 1.
An eQTL is a genetic region, in which one or more SNPs are significantly associated with the RNA level of a gene.
The example SNP here has two alleles, C and T . The C allele is associated with a significant decrease of RNA compared to to the T allele.
Qtlizer provides access to more than 37 million eQTL associations which cover more than 100 tissues, 3.8 million SNPs, 32,000 genes and 150 eQTL studies.
Figure 1.
An eQTL is a genetic region, in which one or more SNPs are significantly associated with the RNA level of a gene.
The example SNP here has two alleles, C and T . The C allele is associated with a significant decrease of RNA compared to to the T allele.
Qtlizer provides access to more than 37 million eQTL associations which cover more than 100 tissues, 3.8 million SNPs, 32,000 genes and 150 eQTL studies.
eQTLs
A genetic region (locus) that is associated with the expression of a gene (-> Gene) is called an expression quantitative trait locus (eQTL) (Figure 1). eQTLs are typically assessed on a genome-wide scale by statistically testing a large number of variants for association with RNA levels of genes nearby (cis) or located anywhere else in the genome (trans). To be considered an eQTL, one or more variants in the region have to be significantly associated with the expression of the corresponding eQTL gene. The most strongly associated variant, i.e. the variant with smallest P-value, is called the index (or sentinel) variant (-> Index variant). In Qtlizer, we define an eQTL SNP as cis if it is located in the same topological associated domain as the corresponding gene and as trans otherwise (-> Co-localization). We further specify the distance of the eQTL SNP from the corresponding eQTL gene in kilobases (according to GRCh38) (-> Distance). For a SNP located within gene boundaries, distance is zero. If a variant is associated with increase in expression, beta is positive, and if it is associated with decrease in expression, beta is negative (-> Beta). The effect allele, that is the allele with respect to which beta is computed in the respective study, may differ between studies and is sometimes not provided. Thus, Qtlizer only specifies beta if the effect allele was given by the source study.
Typical eQTL use case: Aiding GWAS interpretation
Information on eQTLs is often used after disease-associated variants have been identified in a genome-wide association study (GWAS) to pinpoint possible causal variants. If a variant is associated with a disease and it is an eQTL for a gene, dysregulation of this gene may cause the disease. Thus, Qtlizer reports whether a listed eQTL variant is disease-associated according to a published GWAS using the GWAS Catalog.
In order to return eQTLs for variants that are linked to an index variant via linkage disequilibrium (LD, specified by r2 or D', i.e. Dprime), Qtlizer has the option to include eQTL proxy variants (-> Proxy variant). Optional display information concerning proxy variants (provided also through the REST API) are the method with which LD has been computed and the user-specified linkage disequilibrium (LD) threshold.
Variant coverage and cross-study consistency counts
Qtlizer includes a large number of eQTL studies for many different tissues. To get an impression of variant coverage and cross-study consistency, several counts are given (-> Counts).
One count specifies the number of variants assessed for a gene in the respective study, n_eqtls. It allows to compare the number of variants assessed for this gene in the respective study with the number of variants assessed in other studies for the same gene.
The other counts denote the number of studies in which a variant has been assessed, n_occ, in how many of them it was study-wide significant, n_sw_sign, and in how many of them it is the best eQTL variant for this gene in the respective tissue, n_best studies. Note that n_occ >= n_sw_sign >= n_best. For determining whether or not a genomic region is an eQTL, certainty increases with the number of study-wide significant findings (n_sw_sign). In order to identify the most likely eQTL variant driving the association signal from a set of variants in a region, certainty increases with the number of studies designating a variant as the best variant (n_best).
n_qtls: number of eQTL variants for the listed gene (-> Gene) in the given study (-> Source)
n_best: number of studies in which this eQTL variant is the best eQTL variant for the listed gene
n_sw_sign: number of studies in which the eQTL variant is study-wide significant for this gene
n_occ: number of studies in which this variant has been assessed
How to use it
Input form
The input form is shown in Figure 2. It consists of a text field in which query SNP or gene terms can be pasted.
Allowed terms for SNPs:- Reference SNP cluster ID (Rsid):
rs + number e.g. "rs4284742" - Genetic region in the format
reference:chr:pos , e.g. "hg19:19:45412079" (Allowed references: hg19/GRCh37, hg38/GRCh38; accepted chromosomes are 1-22)
- HGNC gene symbols (https://www.genenames.org/about/guidelines/), e.g. DEFA1
- Ensembl gene/transcript identifiers, e.g. ENSG00000122194
- EntrezGene identifiers, e.g. 7157
- UniProKB identifiers, e.g. P04637
Optionally, the query SNP's proxy variants can be displayed as well by specifying a linkage disequilibrium threshold using either r2 or D'(Dprime).
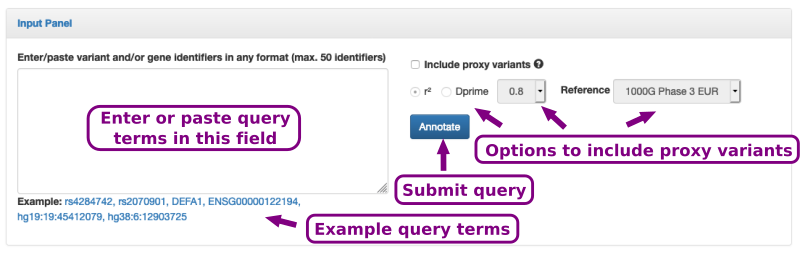 Figure 2. The input form consists of a text field in which SNP identifier (rsIDs) can be pasted. Moreover, further options allow to include proxy variants.
Qtlizer results view
An example output is shown in Figure 3. It consists of a table in which each row represents a tissue- and source-specific eQTL variant-to-gene pair tested within the corresponding, listed eQTL study. Note that Qtlizer lists all variant-gene pairs for which information was provided in the source eQTL studies and that those not tagged is_sw_sign are no significant eQTLs! This table can be sorted according to any column by clicking on the blue arrows next to the column headers. The results can be filtered interactively to display only a subset of entries by clicking on the buttons at the top of a respective column and then selecting the checkboxes of the items to be displayed. The initial results table displays the most relevant columns; additional columns can be selected and displayed. All columns are included in the tab-delimited text file that can be downloaded via the Download Button.
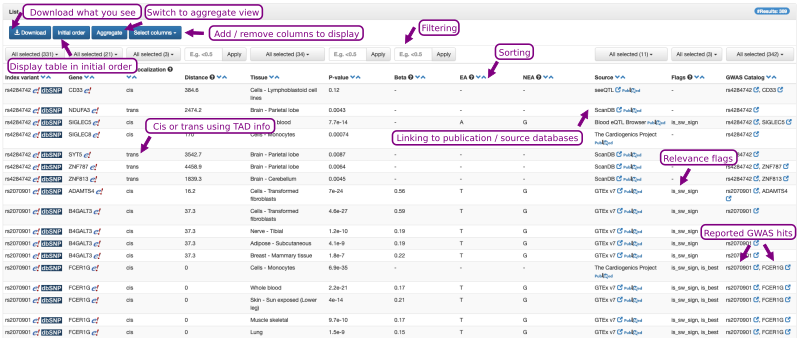 Figure 3. The output of Qtlizer is a table that can be sorted and filtered interactively.
Qtlizer aggregate view
Qtlizer also compiles an aggregate view of the result table when using the Aggregate Button, this is shown in Figure 4. In this aggregate view, there is one row for every pair of query index variant and gene. For this variant-gene combination, given in aggregate form are the different tissues for which there is an eQTL. The best P-value specified in brackets for each tissue is the lowest P-value for the query SNP over all studies/sources assessing this tissue.
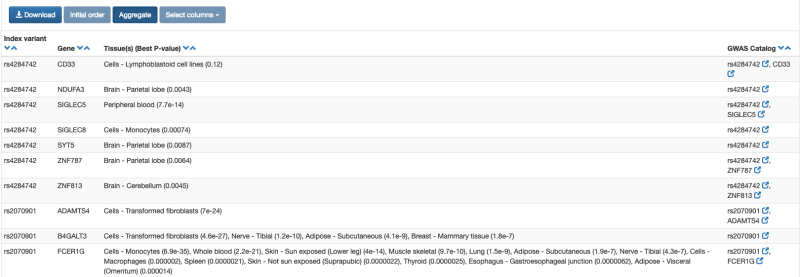 Figure 4. Qtlizer aggregate results view.
eQTL datasets in Qtlizer
Qtlizer incorporates 166 tissue-specific eQTL datasets from the public domain as well as two recently released eQTL datasets generated by The Cardiogenics Project (Table 1). A detailed list of all these eQTL studies can be downloaded here. This list provides source, Pubmed ID, tissue, QTL type, and number of variants. The number of variants differs significantly between studies, because for some studies only significant eQTL variants are publicly available, whereas for others all tested variants are provided.
Table 1. Sources of publicly available eQTL data sets that have been included into Qtlizer.
| Source | Tissue | PMID | |
|---|---|---|---|
| 1. | Blood eQTL Browser | Peripheral blood | 24013639 |
| 2. | Franzén et al. (Science 2016) | Adipose - Subcutaneous, Adipose - Visceral (Abdominal), Adrenal gland, Artery - Aorta, Artery - Mammary, Artery - Tibial, Atherosclerotic aortic root, Blood, Brain - Hypothalamus, Brain - Nucleus accumbens (Basal ganglia), Brain - Putamen (Basal ganglia), Cells - Transformed fibroblasts, Colon - Transverse, Esophagus - Mucosa, Esophagus - Muscularis, Heart - Left ventricle, Liver, Lung, Muscle skeletal, Nerve - Tibial, Pancreas, Prostate, Skin - Not sun exposed (Suprapubic), Skin - Sun exposed (Lower leg), Testis, Thyroid, Whole blood | 27540175 |
| 3. | GEUVADIS | Cells - Lymphoblastoid cell lines | 24037378 |
| 4. | GRASP 2 Catalog | Adipose - Gluteal, Adipose - Subcutaneous (Abdominal), Adipose - Visceral (Omentum majus), Blood, Blood cells in celiac disease, Brain - Cerebellum in alzheimer's disease cases, Brain - Cerebellum in alzheimer's disease cases and controls, Brain - Cerebellum in non-alzheimer's disease samples, Brain - Cerebellum in progressive supranuclear palsy cases, Brain - Cortex, Brain - Cortex with alzheimer's interaction, Brain - Cortex with no alzheimer's interaction, Brain - Prefrontal cortex, Brain - Temporal cortex in alzheimer's disease cases, Brain - Temporal cortex in alzheimer's disease cases and controls, Brain - Temporal cortex in non-alzheimer's disease samples, Brain - Temporal cortex in progressive supranuclear palsy cases, Breast tumors, Cells - Aortic endothelial cells, Cells - Aortic endothelial cells treated with OX-PAPC, Cells - B-lymphoblastoid cell lines, Cells - CD4+ lymphocytes, Cells - Dendritic cells, Cells - Dendritic cells treated with mycobacterium tuberculosis, Cells - Fibroblasts, Cells - Fibroblasts, T cells and B | 17873877, 17873877, 18478092, 19128478, 19222302, 19361613, 19644074, 19654370, 19680542, 19966804, 20084173, 20170901, 20351726, 20833654, 20844574, 21226949, 21637794, 21789213, 21829388, 21949713, 22006096, 22233810, 22383892, 22447449, 22509407, 22522925, 22685416, 22692066, 22912676, 23474282, 23671422 |
| 5. | GTEx v8 | Adipose - Subcutaneous, Adipose - Visceral (Omentum), Adrenal gland, Artery - Aorta, Artery - Coronary, Artery - Tibial, Brain - Amygdala, Brain - Anterior cingulate cortex (BA24), Brain - Caudate (Basal ganglia), Brain - Cerebellar hemisphere, Brain - Cerebellum, Brain - Cortex, Brain - Frontal cortex (BA9), Brain - Hippocampus, Brain - Hypothalamus, Brain - Nucleus accumbens (Basal ganglia), Brain - Putamen (Basal ganglia), Brain - Spinal cord (Cervical c-1), Brain - Substantia nigra, Breast - Mammary tissue, Cells - EBV-transformed lymphocytes, Cells - Transformed fibroblasts, Colon - Sigmoid, Colon - Transverse, Esophagus - Gastroesophageal junction, Esophagus - Mucosa, Esophagus - Muscularis, Heart - Atrial appendage, Heart - Left ventricle, Kidney - Cortex, Liver, Lung, Minor salivary gland, Muscle skeletal, Nerve - Tibial, Ovary, Pancreas, Pituitary, Prostate, Skin - Not sun exposed (Suprapubic), Skin - Sun exposed (Lower leg), Small intestine - Terminal ileum, Spleen, Stomach, Testis, Thyroid, Uterus, Vagina, Whole blood | 23715323 |
| 6. | Haploreg v4.1* | Brain - Aveall, Brain - Cerebellum, Brain - Frontal cortex, Brain - Hippocampus, Brain - Inferior olivary nucleus, Brain - Intralobular white matter, Brain - Occipital cortex, Brain - Pons, Brain - Putamen, Brain - Substantia nigra, Brain - Temporal Cortex, Brain - Thalamus, Cells - Lymphoblastoid cell lines, Cells - Monocytes, Cells - Monocytes IFN, Cells - Monocytes LPS2, Cells - Monocytes LPS24, Heart, Liver, Lung, Osteoblasts, Osteoblasts BMP2, Osteoblasts DEX, Osteoblasts PGE2 | 17873874, 18462017, 20220756, 20485568, 21283786, 23209423, 24604202, 24846176, 25174004 |
| 7. | Kim et al. (Nature Comm 2017) | Cells - Monocytes, Cells - Monocytes (stimulated with LPS/IVT/MDP vs. unstimulated)** | 28814792 |
| 8. | pGWAS*** | Blood plasma | 28240269 |
| 9. | ScanDB | Brain - Cerebellum, Brain - Parietal lobe, Liver | 19933162 |
| 10. | seeQTL | Brain, Cells - Lymphoblastoid cell lines | 17982457, 22171328 |
| 11. | The Cardiogenics Project | Cells - Macrophages, Cells - Monocytes | 23382694, 27558669 |
| 12. | Zeller et al. (PlosONE 2010) | Cells - Monocytes | 20502693 |
| 13. | NephQTL | Kidney - Glomerulus (Nephrotic syndrome cases), Kidney - Tubulointerstitial (Nephrotic syndrome cases) | 30057032 |
**Response expression QTLs (reQTLs)
***Protein abundance QTLs (pQTLs).
A note of caution
We compiled many public eQTL data sets within Qtlizer. These individual data sets may differ in many aspects, for example
- Sample size and statistical power
- Experimental technique used for expression quantification, e.g. microarray versus RNA-Seq
- Genotyping platform
- Disease status and genetic background of genotyped individuals
- Data preprocessing and normalization techniques used
- Statistical methods applied
- Number of SNPs tested
- Effect allele tested
- Multiple testing correction applied
- Number and selection of SNPs with publicly available information which could be added to the Qtlizer data base, e.g. all tested SNPs or only study-wide significant SNPs
Because of the large number of data sets in Qtlizer (n=168), we cannot comprehensively review all individual studies. Thus, before drawing conclusions from Qtlizer, e.g. about presence or absence of an eQTL in a genetic region or for a SNP or gene of interest, the user should refer to the original publications of the relevant eQTL data sets and review these aspects.
Implementation
Qtlizer was implemented in Perl (Extraction, transformation and loading [ETL] process), Java (Web application backend), Javascript (Web application frontend) and SQL (Database queries) by using the Play! Framework and Twitter Bootstrap. We chose MySQL as database management system. An overview of the database build and query processes is shown in Figure 5.
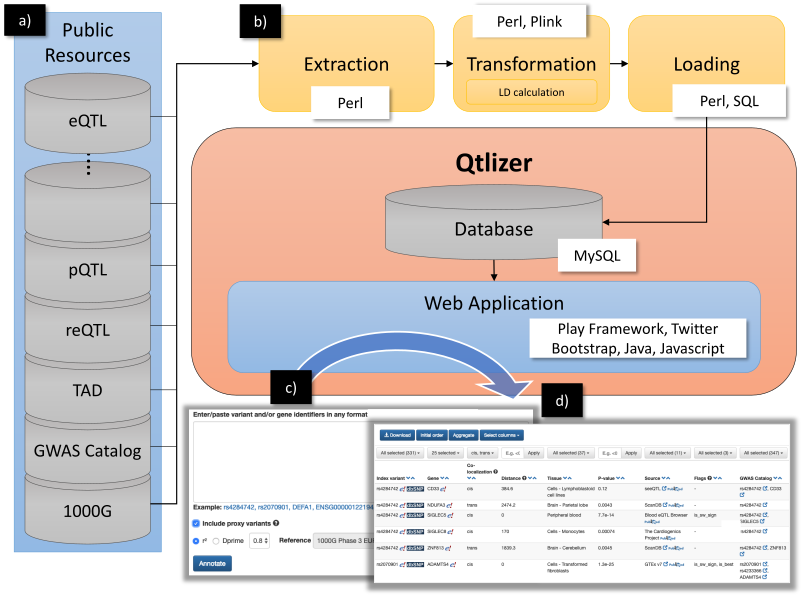 Figure 5. (a) Data from various public available resources was integrated by
(b) applying an ETL process.
(c) Qtlizer can be queried for eQTL data via the web-based user interface by inputting lists of genetic variants or chromosome positions or, alternatively, genes into a text field.
(d) The annotation results are displayed in a sortable table view which can be interactively filtered.
Figure 5. (a) Data from various public available resources was integrated by
(b) applying an ETL process.
(c) Qtlizer can be queried for eQTL data via the web-based user interface by inputting lists of genetic variants or chromosome positions or, alternatively, genes into a text field.
(d) The annotation results are displayed in a sortable table view which can be interactively filtered.
REST API & R package
Qtlizer can be queried for eQTL data via the web-based user interface or programmatically by inputting lists of genetic variants using a REST API. A guide on how to use the REST API with examples in R and Perl is available here.
We also provide a R package which builds upon the REST API.
Browser compatibility
| OS | Version | Chrome | Firefox | Microsoft Edge | Safari |
|---|---|---|---|---|---|
| Linux | Ubuntu 16.04 | 72.0 | 65.0 | n/a | n/a |
| MacOS | Mojave | 72.0 | 65.0 | n/a | 12.0.3 |
| Windows | 10 | 72.0 | 65.0 | 42 | n/a |